Preparing your download
StatPlanet is being verified and prepared...
- Size
- 2.78 MB
- Downloads
- 0+
- Update date
- Sep 17, 2025
App details
- Version
- 1.0
- Size
- 2.78 MB
- Updated
- April 18, 2010
- Requires
- Windows 2000
- Language
- English
- License
- Free
- Developer
- Frank van Cappelle
- Category
- Windows OS
How to install StatPlanet
How to install XAPK / APK file
- Download the XAPK/APK file from the button above.
- Open your device's file manager and locate the downloaded file.
- Tap the file to begin installation.
- If prompted, open settings and enable installs from unknown sources.
- Follow the on-screen instructions to complete the installation.
Description
Download StatPlanet – Interactive Demographic Maps, Free Data Visualization Tool
Overview: Turning Raw Numbers into Visual Stories
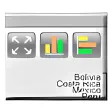
StatPlanet is a free, lightweight application that turns global statistical data into colorful, easy‑to‑read maps and charts. Designed for students, researchers, and anyone curious about social development, the tool aggregates demographic, education, environmental, health, and socio‑economic indicators from virtually every country. By presenting data through interactive, color‑coded maps, simple graphs, proportional maps, and bar charts, StatPlanet makes complex information instantly understandable. Users can zoom, pan, and click to drill down into specific regions, while tooltips provide on‑the‑spot explanations of each metric. The latest version (2.0) expands the visual repertoire with bullet graphs, scatter‑plot trails, and dedicated USA and world maps, while also improving the interface for smoother navigation. Although the software focuses on static export (PDF, PNG) rather than live dashboards, its bookmarking feature allows quick access to frequently used layers, turning a plain data set into a personal research companion. Because it runs on modest hardware, StatPlanet is ideal for laptops, desktop PCs, and even older machines that struggle with heavyweight analytics platforms. In short, StatPlanet offers a free, secure, and user‑friendly way to explore world statistics without the steep learning curve of professional GIS or business‑intelligence suites.
Key Features & Interface Highlights
- Interactive world and USA maps with click‑to‑zoom and mouse‑wheel navigation.
- Nine primary indicator categories covering demographics, population, health, gender, education, environment, and more.
- Sub‑category breakdowns that let you focus on specific age groups, disease types, or education levels.
- Multiple visualization modes: color‑coded choropleth maps, proportional maps, bar charts, line graphs, bullet graphs, and scatter‑plot trails.
- Bookmarking function that pins selected layers as floating windows for quick reference.
- Tooltips that display exact values and brief definitions when hovering over a region.
- Export options for static images and printable PDFs, enabling easy inclusion in reports or presentations.
- Simple, clean UI that runs on basic computer configurations without demanding graphics cards.
- Free download with regular updates that add new data sets and visual types.
Beyond the core visual tools, StatPlanet’s design philosophy emphasizes clarity over clutter. The color palettes are chosen to be distinguishable for color‑blind users, and the legend updates dynamically to match the selected indicator. While the software does not offer real‑time data feeds, it incorporates the latest publicly available datasets from reputable sources such as the United Nations, World Bank, and WHO, ensuring that users work with accurate and up‑to‑date information. The interface improvements in version 2.0 also include a customizable toolbar, allowing users to hide or reveal specific controls based on their workflow. This modular approach means you can keep the screen tidy while still having powerful analytical capabilities at your fingertips.
Installation, Compatibility & How to Use StatPlanet
Step‑by‑Step Installation Guide
Downloading and installing StatPlanet is straightforward. Visit the official StatPlanet website, click the “Download for Windows” button, and save the installer (≈ 45 MB). Run the .exe file, accept the license agreement, and follow the on‑screen prompts. The installer automatically creates a desktop shortcut and registers the program with Windows for easy updates. For macOS users, a separate .dmg file is available; simply drag the StatPlanet icon to the Applications folder. Linux users can use the provided .tar.gz archive and run the included script, though official support is limited to Windows and macOS.
System Requirements & Operating System Support
StatPlanet runs on Windows 7, 8, 10, and 11 (both 32‑bit and 64‑bit) as well as macOS 10.12 Sierra and later. Minimum hardware requirements are modest: a 1 GHz processor, 512 MB RAM, and 200 MB of free disk space. Because the application relies primarily on vector rendering rather than heavy 3D graphics, it functions smoothly on older laptops and netbooks. No special GPU is needed, making it a good fit for educational institutions with limited IT budgets.
Basic Workflow: From Data Selection to Export
Once installed, launch StatPlanet and you’ll be greeted by a splash screen that lets you choose a region (World, USA, or a custom country list). Select an indicator from the left‑hand panel—e.g., “Life Expectancy at Birth”—and the map instantly updates with a gradient reflecting the values. Use the mouse wheel to zoom into a city or region, and click on any area to see a tooltip with the exact figure. To compare multiple indicators, enable the “Overlay” option and choose a second metric; the software will blend the colors and update the legend accordingly.
When you’ve crafted the perfect visual, click the “Export” button. Choose between PNG, JPEG, or PDF, name your file, and save it to a desired folder. The exported image preserves the current zoom level and legend, making it ready for insertion into reports, presentations, or academic papers. For recurring projects, you can save a “bookmark” that stores your current selections and layout; reopening StatPlanet later will restore the exact view, saving you time on repetitive tasks.
Pros, Cons & Frequently Asked Questions
What Users Love About StatPlanet
- Free and open access: No subscription fees or hidden costs.
- Intuitive interface: Easy for beginners, yet powerful enough for advanced analysis.
- Broad data coverage: Over 200 indicators from reputable global sources.
- Cross‑platform availability: Works on Windows and macOS.
- Lightweight footprint: Runs smoothly on older hardware.
Areas Where StatPlanet Could Improve
- Static export only – no live dashboards or interactive web embeds.
- Limited customization of color schemes and map projections.
- No built‑in data editing; users must rely on external tools for data manipulation.
- Linux support is unofficial and may require manual configuration.
- Advanced analytics (regression, clustering) are outside the scope of the tool.
FAQ – Your Questions Answered
Is StatPlanet really free to use?
Yes. StatPlanet is offered at no cost for personal, educational, and non‑commercial use. All core features, including map navigation and static export, are available without a license fee.
Can I update the data sets after installation?
StatPlanet checks for updates each time it launches. When a new data release is available, a prompt appears allowing you to download the latest indicators automatically.
What file formats are supported for export?
Exports can be saved as PNG, JPEG, or PDF. These formats preserve the visual layout, legend, and any annotations you added.
Is there a way to import my own data into StatPlanet?
The current version does not support custom data imports. Users must rely on the built‑in indicator library, which is regularly updated from official sources.
How does StatPlanet handle accessibility for color‑blind users?
Color palettes are designed with contrast in mind, and the legend includes numeric ranges, so users can interpret maps without relying solely on color cues.
Expert Review Summary
StatPlanet excels at turning dense statistical tables into vivid, interactive visualizations. Its free model and low system requirements make it accessible to a wide audience, from high‑school students to development researchers. While the lack of live data linking and advanced analytics limits its use for professional data scientists, the tool’s ease of use, robust indicator library, and clean export options make it a valuable addition to any classroom or policy‑briefing toolkit.
- Pros: Free, intuitive, broad coverage, cross‑platform.
- Cons: No custom data import, static export only, limited Linux support.
Conclusion & Call to Action
StatPlanet stands out as a niche yet powerful solution for anyone who wants to explore global statistics without wrestling with complex GIS software. Its interactive maps, straightforward interface, and extensive indicator set provide a fresh way to visualize the stories hidden in raw numbers. Because the application is free, regularly updated, and runs on modest hardware, it is especially well‑suited for students, educators, and NGOs that need reliable visual aids on a tight budget. If you are ready to transform data into compelling, color‑coded narratives, simply download StatPlanet today and start exploring the world’s demographics, health trends, and socio‑economic patterns with just a few clicks.
Remember to check for updates periodically, bookmark your favorite indicator sets, and use the export function to embed your maps in reports or presentations. With StatPlanet, the world’s data is finally at your fingertips—clear, engaging, and ready to inform the decisions that shape our future.
Download safety
TotalVirus Scanned
This software has been scanned for malware and verified safe for download.SoftPas in:
This product is also available in the following languages: